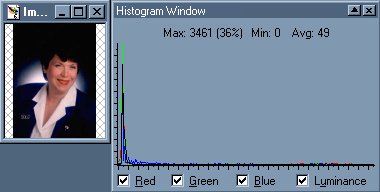
 TOO DARK |
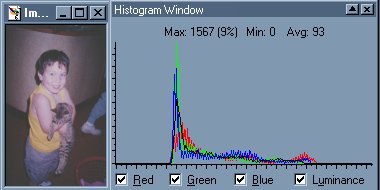 NOT ENOUGH CONTRAST |
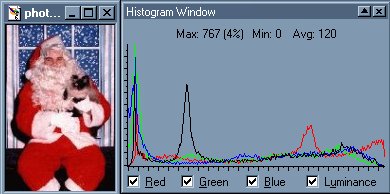 GOOD CONTRAST |
Histogram: This tool bar displays the RGB pixels and the luminance
values at each lightness level. The horizontal axis displays dark to light (left to
right), and the vertical axis displays the number of pixels of that value at each point.
If there are many pixels at a value, spikes are created. Displayed along the top of the
window are the number of pixels that match the max. and min. for the histogram. It also
gives the average value. You can use the histogram to determine if there is enough
contrast to make corrections, and where they should be corrected.
The graph should be spread out across the histogram. If it is too condensed there is not
enough detail to make corrections (see 2nd image below). If it is more on the left side
(see first image below), it is too dark and should be lightened.
Stretching and Equalizing the Histogram changes the shape of the histogram and
alters the image.
Equalize: creates an averaging of the image brightness by making the darkest
pixels as close to black and the lightest pixels as close to white as possible, while
evenly distributing the other pixels in between.
Stretch: stretches the graph of an image with very little contrast, evenly
across the spectrum from light to dark, giving it more contrast.
| TOO DARK |
| NOT ENOUGH CONTRAST |
| GOOD CONTRAST |